DebugParser
Plugin to find site bottlenecks. Shows all processed tags and time spent

Plugin to find site bottlenecks. Shows all processed tags and time spent.
You can pinpoint and optimize slow calls on each page.
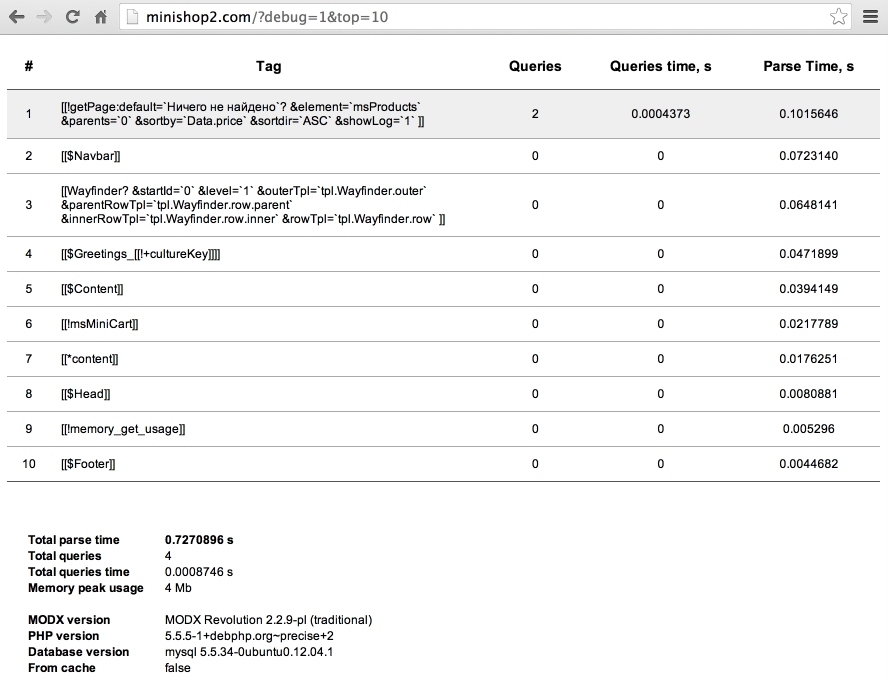
The table shows each MODX tag call, database queries count, query time, and total processing time.
If a tag is called multiple times on a page, those calls are summed.
Внимание
Queries and Queries time may be inaccurate if a snippet uses the database directly and does not write to modX::executedQueries and modX::queryTime. For example, pdoResources does, getProducts does not.
At the bottom you see totals and general info: PHP version, DB, etc.
The debugParser plugin runs only for users logged in to the mgr context. It reads parameters from $_GET.
debug — Enables debug mode and shows the table.cache — Allow page caching. Default: no.top — Number of tags to show. Default: unlimited.add — Append the table to the page instead of replacing it. Default: no.To see Fenom template engine tag execution you need:
{$_modx}; the default {$modx} cannot be tracked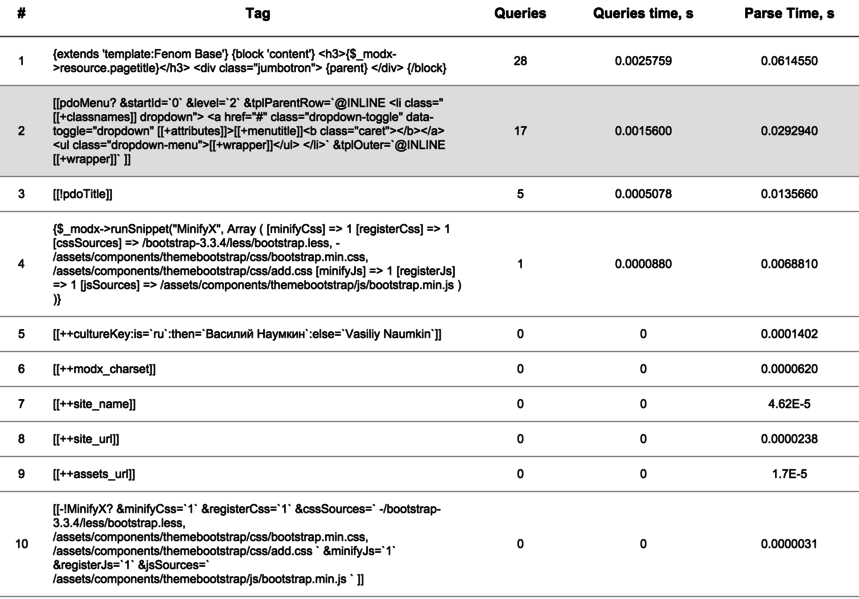
Basic output:
http://mysite.com/?debug=1
The report table replaces the page content, so you only see the table.
With cache:
http://mysite.com/?debug=1&cache=1
If the page is loaded from cache, only uncached tags are processed and shown.
Top 10 slowest tags:
http://mysite.com/?debug=1&cache=1&top=10
Tags are sorted by execution time, so you can show only the heaviest ones.
Append table to page content:
http://mysite.com/?debug=1&cache=1&top=10&add=1